LAB 3: Downloading GIS Data
Introduction: The overall goal of this lab was to retrieve
data from the internet to portray Census Information for the state of
Wisconsin. In order to achieve this goal I had to follow a series of
objectives. I had to learn how to download census data, in this case it was the
total population from the Census Bureau Website. Then I had to download shapefiles
of Wisconsin counties from the same website so I could then represent the data
on a Wisconsin map. After this I learned to join the actual data to shapefiles
so I could then map it.
Methods: the first
step was to locate and download the actual data from the Census Bureau. In
order to do this I had to do an advanced search to find the total population
data. After I narrowed down my search to find the population data I checked the
box next to the data I wanted to download and saved the zip file in a folder,
where I then extracted it. After I had the population data I had to download
the shapefiles that I was going to use to portray the information, in this case
Wisconsin counties. Through the same website I downloaded Wisconsin counties as
a shapefile into the same folder.
After I had all the data I needed I could then start using
ArcMap to map the data. The first step was to add the Wisconsin counties
shapefile to the map. After that I had to open the population data in an excel
document where I could then save it as an excel workbook. Once it was saved as
an excel workbook I could then use the table it in ArcMap and then join the
data with the Wisconsin counties shapefile attribute table. To join the two
tables, I had to find a common attribute between two tables which was the
GEO#id attribute. I could then join the tables based on this attribute and thus
represent the population data through the Wisconsin counties shapefile.
Because the tables were now joined by a common attribute I had
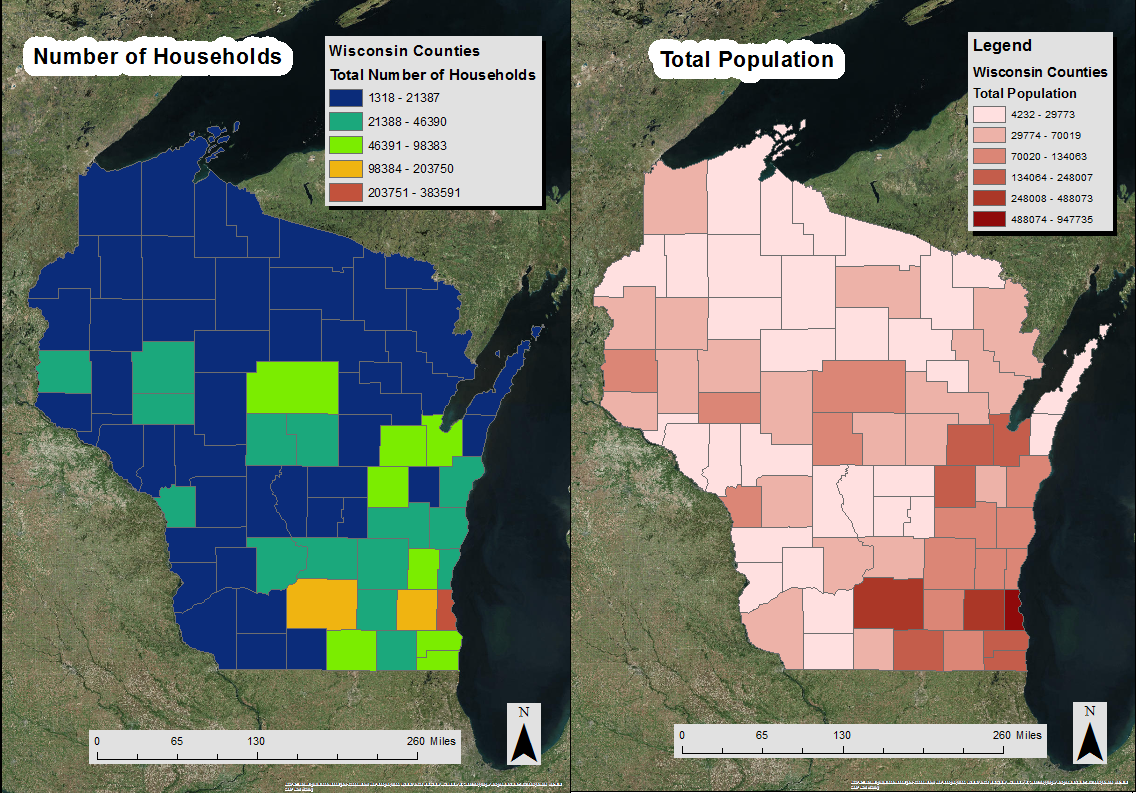
to then create a map to portray the total population of Wisconsin by county. However I first had change the population data column in the attribute table of my counties shapefile to a number type. To do this I added a second column formatted by number type and essentially copied the data from the original population column to the one I recently added. This was necessary in order to be able to symbolize the data under the properties menu. I then opened the properties for the Wisconsin shapefile layer so I could
symbolize the population data by a graduated colors map. I selected the value
in which represented population and chose an appropriate color scheme and
number of classes. Once the information was displayed appropriately through a
graduated color symbol map I then added the appropriate tile, legend, and scale
bar to the map in order to create a more aesthetically pleasing map.
After establishing a final product representing total population
I then created a map similar to this using a different variable. Even though
the steps used to produce the second map were the same, the data which was
downloaded through the Census Bureau was different. Instead of total population
for the state of Wisconsin, the second map portrays the number of households per county symbolized by a similar graduated colors map.


